|
Navigation: RiverSoftAVG Charting Component Suite (RCCS) > Reference Changes for RCCS v6.x |
Scroll Prev Top Next More |
The RiverSoftAVG Products Help v6.x adds many new features to the charting suite. The major changes are listed below. Please see the history.txt file for more detailed information on changes.
The documentation has been vastly improved by using Documentation Insight and Help & Manual: •Help Insight for RiverSoftAVG Products Help •Help available as Code Comments, CHM help file, and Online Help |
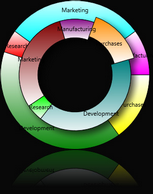
The RCCS has added new charting classes: •Donut Chart (TRSDonutChart and TRSDBDonutChart) •Donut+ Chart (TRSDonutChartEx and TRSDBDonutChartEx) •Bubble Chart (TRSBubbleChart and TRSDBBubbleChart) •Sparse Bar Chart (TRSSparseBarChart) •High/Low/Average Chart (TRSHighLowAverageChart and TRSDBHighLowAverageChart) •CandleStick Chart (TRSCandleStickChart and TRSDBCandleStickChart)
|
The RCCS has added chart functions for transforming any Source charts into any Target Charts using functions: •TRSChartFunction and TRSFMXChartFunction oProvides a large number of functions: Custom, Copy, Sum, Median, Average, Minimum, Maximum, Standard Deviation, Population Standard Deviation, Variance, Population Variance, Total Variance, Sum Of Squares, Euclidean 'L-2' norm, and Greatest Common Divisor functions oProvides a large number of periods for the functions: Source, Index Range, Time Range, Percentage of Count, Percentage of Time Range, Entire Range, Second, Minute, Hour, Day, Week, Month, and Year •TRSHighLowAverageChartFunction and TRSFMXHighLowAverageChartFunction oProvides functions specifically for TRSHighLowAverageChart and TRSCandleStickChart: High/Low, High/Low/Average, High/Low/Median, Mean/Standard Deviation, and High/Low/Average/Open/Close. |
Legends have been improved:  Show Chart Glyphs or Chart Value Glyphs in Legends •Optionally draw glyphs for charts and chart values with integrated TRSChartPanel.Legend and Legend Components •New TRSChartLegendBox (standalone legend component, similar to a paint box)  TRSChartLegendBox, showing Glyphs for chart values, and a TShadowEffect |
In addition to all the new classes and bug fixes, numerous small improvements have been made: •Dynamic Hints and Mouse Tracking lines have been added to TRSChartPanel. This option is on by default. Remove Mouse Tracking from UserActions to use old behavior •Pie Charts (TRSPieChart) have an origin which can be moved •Pie Charts (TRSPieChart) have an OuterRadius which can be used to reduce the size of pie charts •Bar Charts (TRSCustomBarChart) can have individual BarStyles for each chart value •Guide Charts (TRSGuideChart) can now display Captions for guides and Color each guide individually •OnCustomDrawValue event have been added to some charts •New TRSChartLegend.OnGetLegendStrings public event •Optionally zoom pen and font size when zooming charts •New RSChartLegends (and FMX.RS.ChartLegends) unit, containg the new TRSChartLegendBox and the TRSLegendListBox moved from RSChartPanel.pas •New RSBarCharts (and FMX.RS.BarCharts) unit, containg the new TRSSparseBarChart, TRSHighLowAverageBarChart, TRSCandleStickChart, and TRSHighLowAverageChartFunction, and the TRSBarChart and TRSEQChart moved from RSCharts.pas •Refactored GetChartClass function to use a dynamic thread list so that only used chart classes are linked to executable (use RSRegisterAllCharts.pas/FMX.RS.RegisterAllCharts.pas to automatically include all chart types in your executable) •Default behavior of TRSCustomPointChart has changed for drawing points so that they can be zoomed. Use FixedSizePoints property to use old behavior •Default Behavior of TRSCustomChart has changed so labels are drawn magnified if the chart is zoomed in on the vertical axis. Remove coZoomFonts from Options to use old behavior |
RiverSoftAVG Products Help © 1996-2016 Thomas G. Grubb


